Dashboard tour
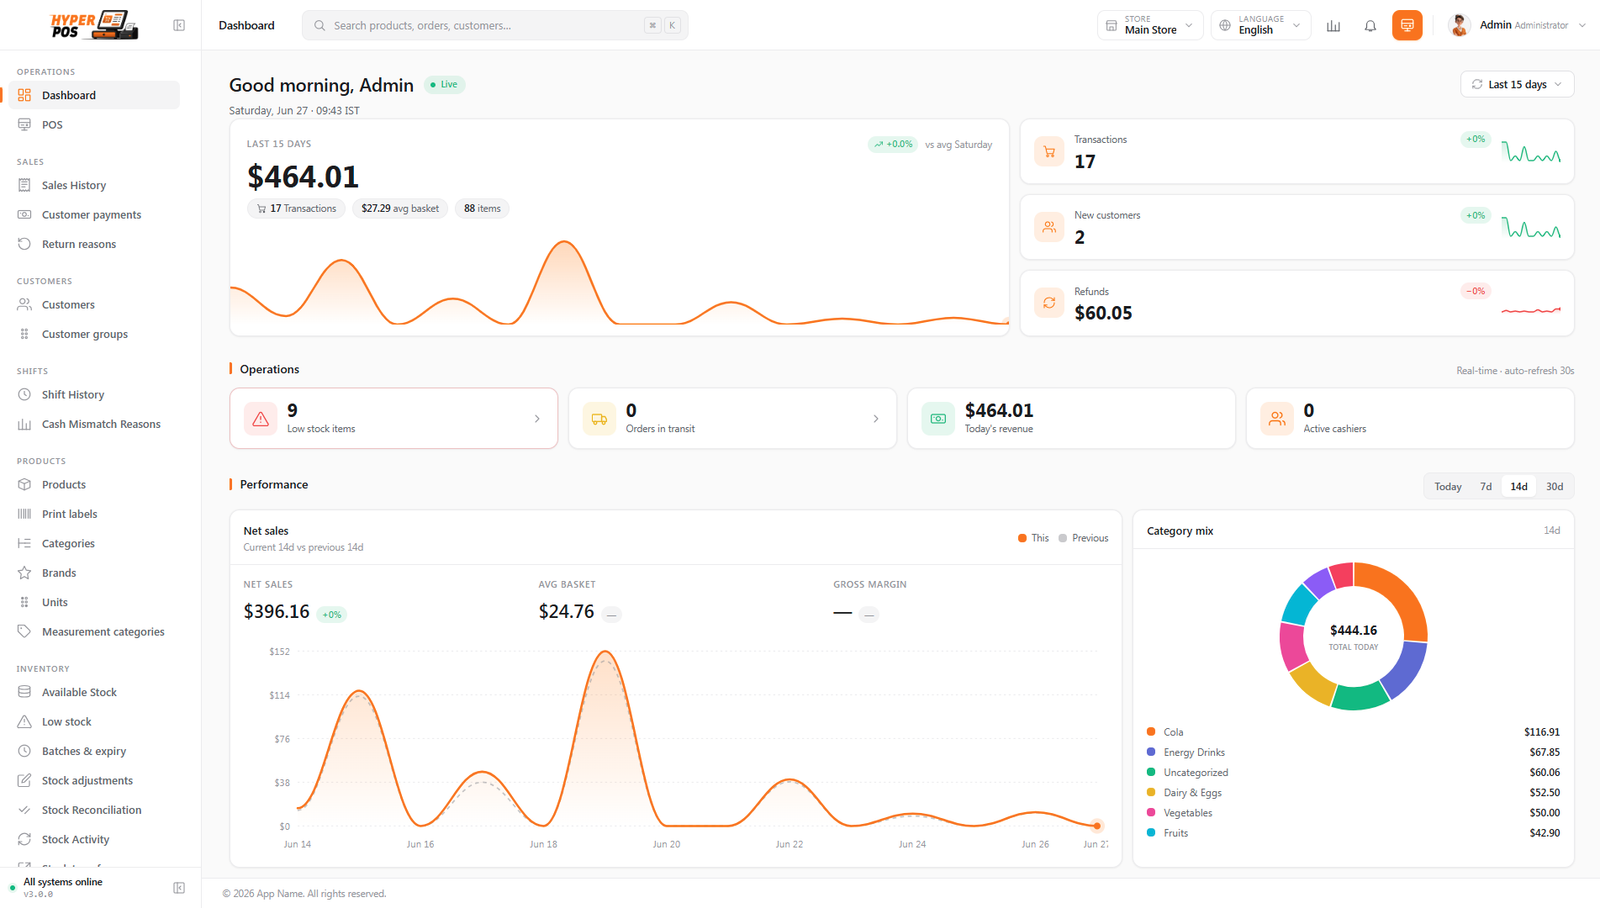
The dashboard is your shop's home screen — the first thing you see after signing in. At a glance it tells you how today is going, what needs your attention, and where to click to get things done.
/admin.Overview
Think of the dashboard as the cover of a newspaper for your business. It pulls together the numbers and lists you'd otherwise have to hunt for across several screens, and shows them in tidy cards (the boxes you see on the page). The exact figures depend on your own sales, so the numbers in this guide are just examples.
You don't have to do anything on the dashboard — it's mostly for reading. But many cards double as shortcuts: click one and it takes you straight to the matching screen with the details.
Why it's useful
- See the day at a glance. Today's takings and number of sales are right at the top, so you always know how trade is going.
- Catch problems early. Low-stock and other alerts flag things that need attention before they become a headache.
- Save clicks. The cards link straight to the screens behind them, so you reach the detail in one tap.
- Spot trends. Simple charts show how recent days compare, helping you plan staffing and stock.
"Get your store ready" — the setup checklist
On a brand-new install the dashboard opens with a setup checklist at the top, along with a progress bar showing how far along you are. It's a short list of the basics a shop needs before it can ring anything up, each with a Set up button that takes you straight to the right screen. Steps tick themselves off as you complete them — there's nothing to mark done by hand.
Seven essentials count towards the progress bar:
| Step | Why it's needed |
|---|---|
| Add your logo | Brands your receipts and the app itself. |
| Add a tax rate | A single rate, like VAT 5%. Tax groups are built out of these. |
| Set up a tax group | The combination of rates actually applied at checkout. |
| Add a category | Keeps the catalog tidy as it grows. |
| Add a product | Something to sell, so a sale can be rung up. |
| Add opening stock | A product with nothing on hand can't be sold. |
| Set up a terminal | A till, so receipts and the cash drawer work. |
Below those sits a Recommended next group — review your payment methods, add a supplier, add a customer, invite a staff member. Useful, but not required to sell, so they don't hold the progress bar back.
Finish the seven essentials and the card congratulates you once, then disappears for good. You can also Dismiss it at any time. Either way it's company-wide: once it's gone, it's gone for every user, and the dashboard is all yours.
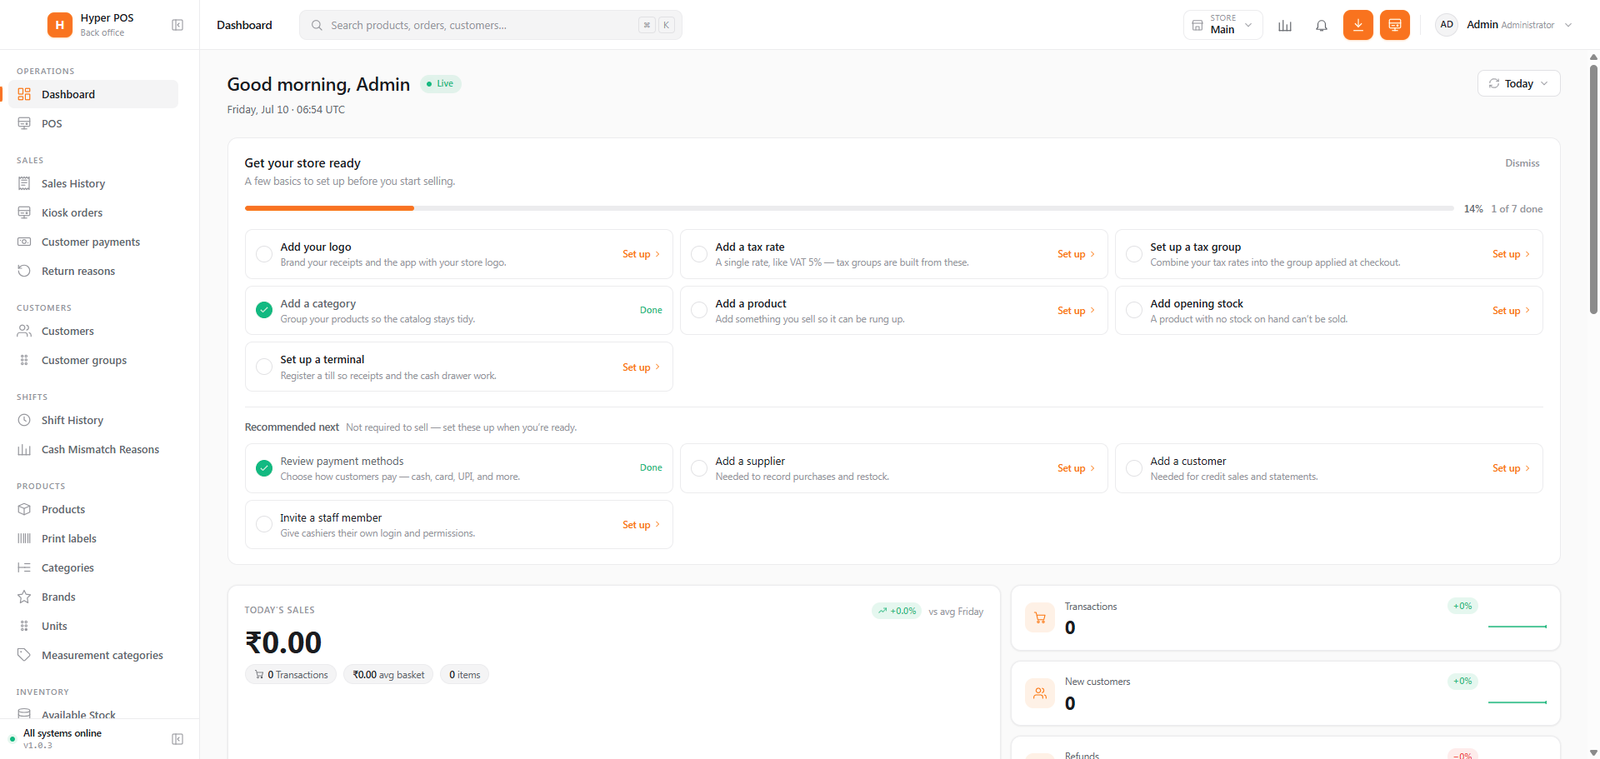
Work down the checklist in order. Tax rates come before tax groups, and products come before opening stock — following the list top-to-bottom means you never land on a screen that's waiting on something else.
How to read the cards
Most cards follow the same simple pattern: a big number, a short label saying what it is, and sometimes a small up-or-down marker comparing it to a previous period. Here's what the common ones mean.
Today's sales
The headline figure — the total money taken so far today — usually with the number of sales and the average basket (the typical amount each customer spends) alongside it. A small line chart shows how sales rose through the day.
Other quick stats
Around the headline you'll find smaller cards for things like the number of transactions, new customers and refunds. Each is just a quick pulse-check; the full breakdown lives in Reports.
Alerts & operations
A strip of attention cards highlights things to act on — most importantly items running low on stock. Clicking one jumps to the relevant list (for example, stock levels) so you can reorder or fix the issue.
Top products, low stock & activity
Lower down, list-style cards show your best-selling products, items that are low on stock, and a live activity feed of recent actions (sales rung up, stock changes and so on). These help you see what's moving and what your team is doing.
If your account doesn't have permission to view financial figures or stock, some cards may be hidden. That's normal — a manager and a cashier can see different dashboards. See Users & roles.
Quick links to common actions
The dashboard is also a launchpad. Look out for small buttons and links such as:
- New and Export near the top, for creating something or downloading the figures you're viewing.
- Manage products, Reorder and See all links on individual cards, which open the matching screen.
- A date range button to switch between today and longer periods on the performance charts.
If you're after a specific screen and can't spot a shortcut, use the sidebar or the search box in the top bar — see Finding your way around.
Tips & best practices
- Start your day here. A quick look tells you yesterday's close, today's start and anything that needs attention.
- Act on low-stock alerts promptly. Reordering before you run out keeps shelves full and customers happy.
- Use the card links instead of hunting in menus. They drop you exactly where you need to be.
- Remember the numbers reflect your chosen store. If you run several stores, switch store from the top bar to see each one's figures.
Notes & warnings
A brand-new install can look empty. Until you've made some sales and added products, several cards will simply show zeros. They fill in naturally as you trade.
The dashboard is a summary, not the full record. For exact figures, audits and downloads, always rely on Reports and Sales history.
Related: Finding your way around · Reports · Stock overview · Sales history