Reports
Reports turn the day-to-day record of your sales into a clear picture of how your shop is doing. Pick a date range, read the numbers, and — if you want — download them to a spreadsheet. No accounting knowledge needed.
Overview
The Reports menu in the sidebar holds a small, focused set of reports — the ones a busy shop actually uses. Each one looks at the same underlying records (your sales, customers and stock), but answers a different question:
- Sales summary — how much you sold over a chosen period, broken down into totals.
- Sales by product — which items sold the most (and the least).
- Aged receivables — which customers owe you money, and how overdue it is. (Receivables just means money customers owe you for credit sales.)
- Loyalty points — points earned, spent and expired, and what your unspent points would cost you.
- Sync log — a record of sales made while offline and whether they've safely uploaded to the server.
Every report works the same way: choose a date range at the top, read the table or chart, and click Export if you want the figures in a spreadsheet.
Why it's useful
- You see the whole shop at a glance. Yesterday's takings, this month's total, your busiest day — all without adding anything up yourself.
- You spot what's working. The best-sellers list tells you what to keep in stock; the slow movers tell you what to discount or drop.
- You chase the money you're owed. Aged receivables shows exactly who's behind on payment so nothing slips through the cracks.
- You can hand clean figures to your accountant. Export any report to CSV or Excel and email it on — no copying numbers by hand.
How to read a report, step by step
-
Open the Reports menu
Click Reports in the left sidebar, then pick the report you want — Sales summary, Sales by product, Aged receivables or Sync log.
-
Choose your date range
At the top of the report there's a date-range selector. Use the quick buttons (such as 7d, 30d or YTD for year-to-date), or pick a custom range with the start and end dates. The report refreshes to cover only that period.
-
Read the numbers
The report shows its figures as a table — and, where it helps, a simple chart. Totals are formatted in your shop's currency, so they read exactly as they would on a receipt.
-
Export it (optional)
Click Export to download the report. Choose CSV (a plain spreadsheet file that opens anywhere) or Excel if you want a tidy, ready-formatted file. The download covers exactly the date range and view you're looking at.
Pick a range, read the totals, export if you need to. Every report below follows that same pattern.
If you run more than one shop, reports also have a store filter — and it only ever offers the stores you're assigned to. Whatever you read on screen, download as a file, or send as a scheduled email stays inside that boundary.
The reports in detail
Sales summary
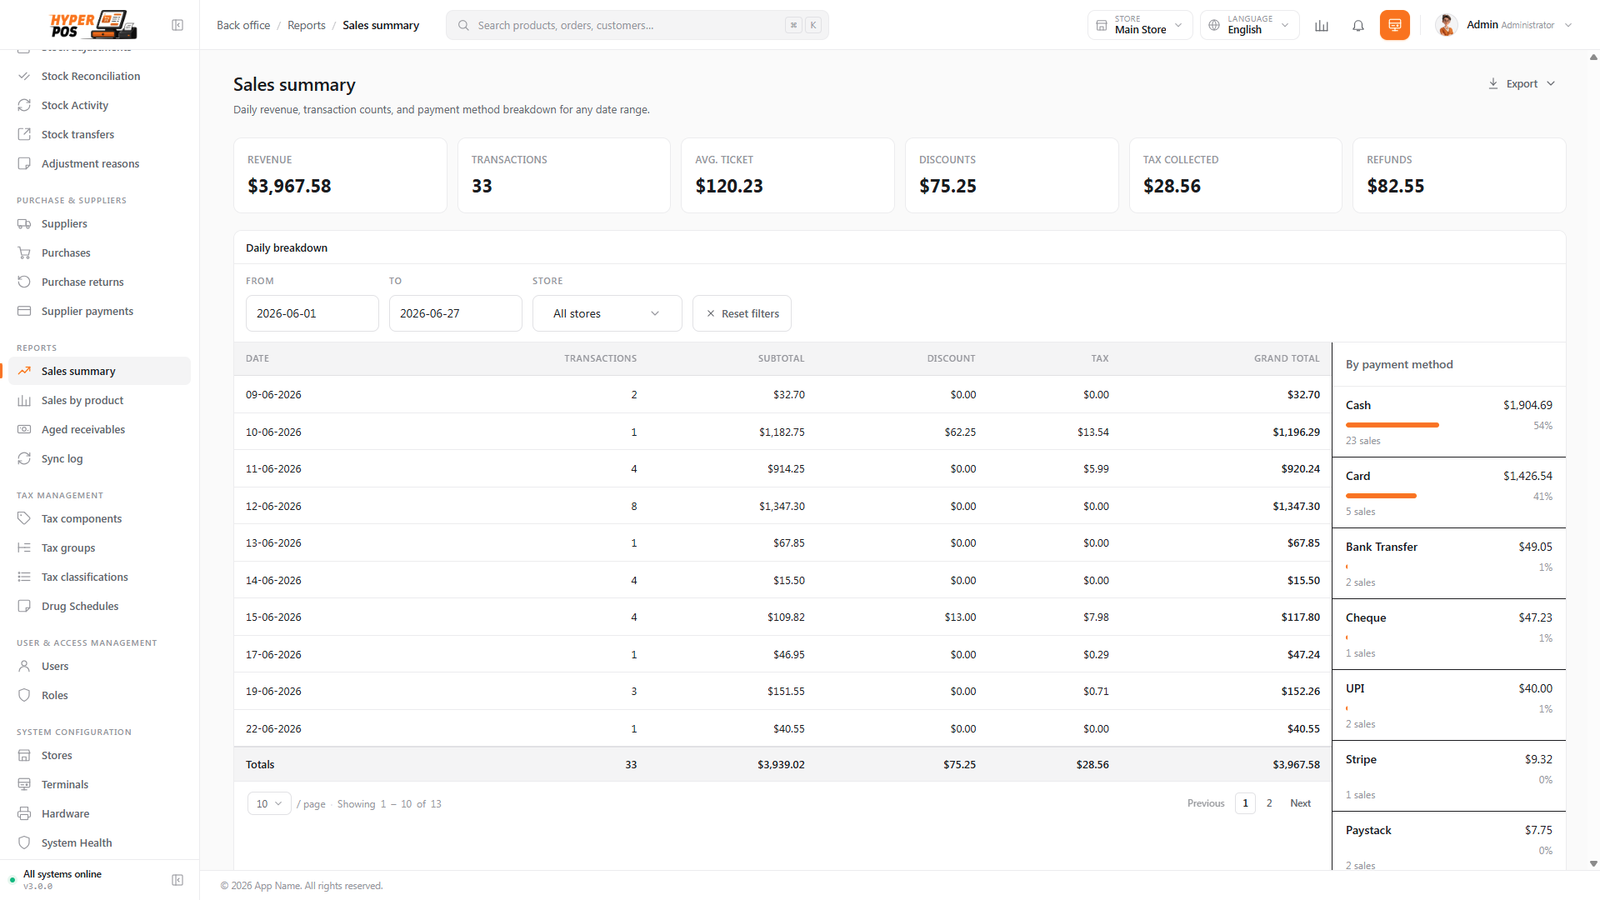
This is the report most owners open first. It adds up everything you sold over the chosen period into a handful of plain totals — gross sales, returns, discounts, the net you actually kept, and the tax collected on top. It's the answer to "how did we do this week?"
A small chart shows the day-by-day trend, so you can see your busy and quiet days at a glance.
Sales by product
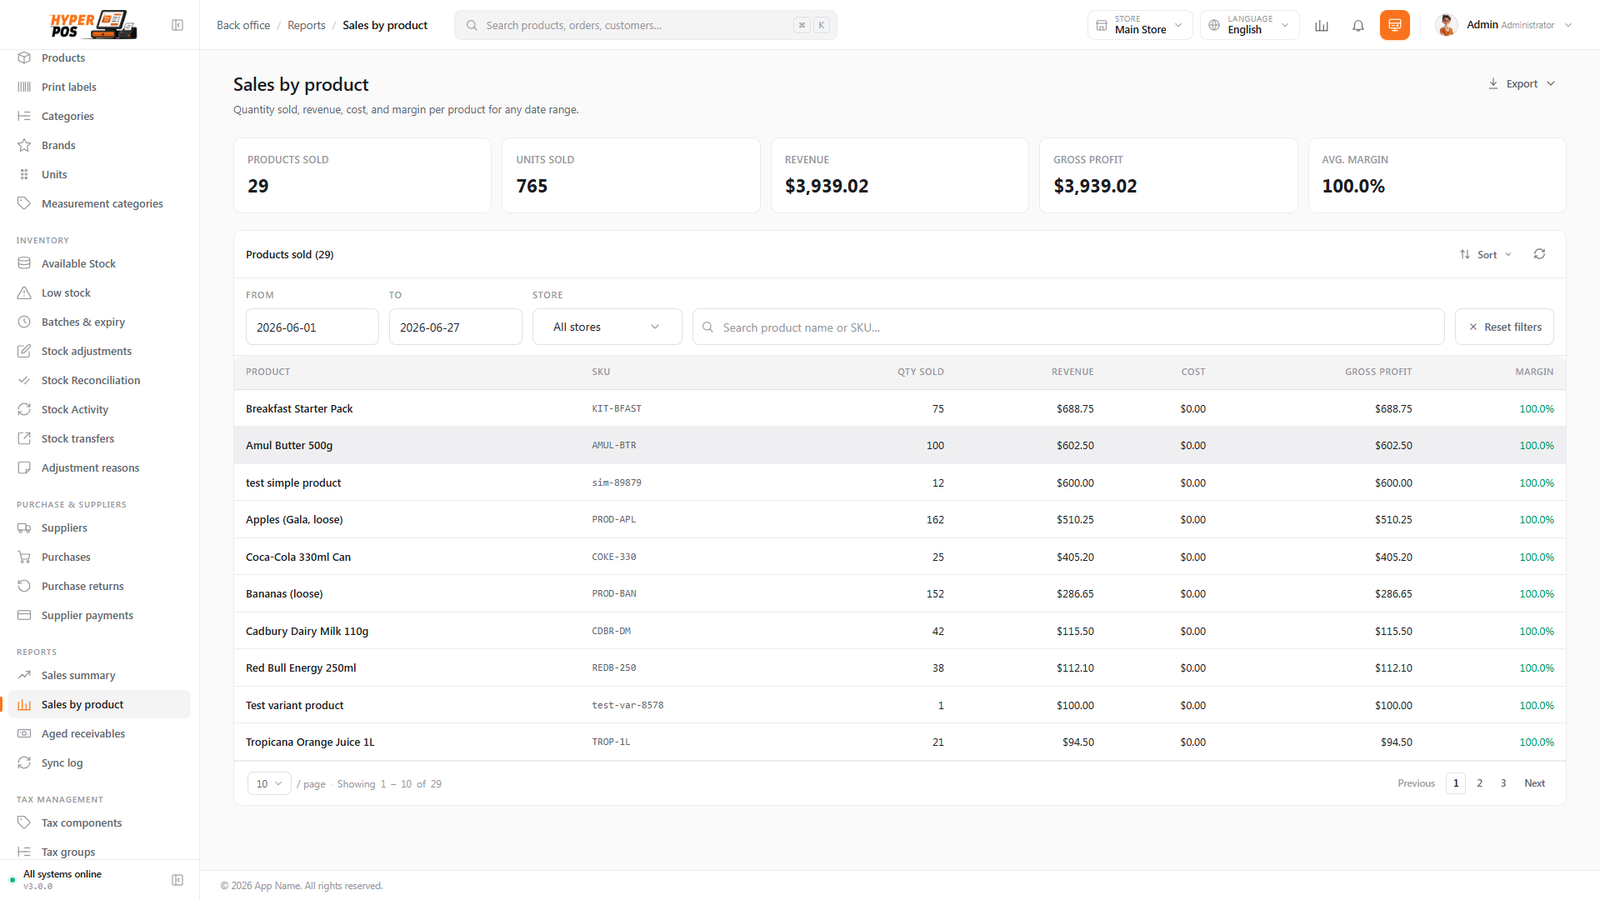
This report lists your products with how many of each sold and how much money each brought in over the period. Sort it to find your best sellers (what to never run out of) and your slow movers (what to discount or stop stocking).
| Column | What it means |
|---|---|
| Product | The item's name and code. |
| Quantity sold | How many units left the shop in this period. |
| Revenue | The money those sales brought in. |
Aged receivables
When a customer buys on credit, they owe you money — that owed money is called a receivable. This report lists every customer with an outstanding balance and groups what they owe by how old it is: still current, 1–30 days overdue, 31–60 days, and so on. The further to the right a figure sits, the longer it's been unpaid — and the sooner you'll want to chase it.
To take a payment against a balance, head to Customer payments.
Loyalty points
If you run a rewards programme (see Loyalty points), this report shows how it's going over any period: points earned, points redeemed, and points that expired unused — with a row per customer underneath so you can see who's collecting and who's spending.
The headline figure is your outstanding liability: what every unspent point in circulation would cost you if all of it were redeemed tomorrow. It's the number to watch before you make the programme more generous.
Sync log
If the internet drops, you can keep selling — those sales are saved on the till and uploaded once you're back online (see Selling offline). The Sync log is the record of that uploading. Each row shows a sale that was made offline and whether it synced successfully, hit a conflict, or failed. It's your reassurance that nothing made offline got lost.
Most of the time every row reads "success" and you never need to look. The tabs at the top let you filter to just the rows that need attention — and a failed row can be retried (the stored sale is re-sent to the server, without any risk of duplicating it) or dismissed if it can never succeed. See When a sale won't sync.
Profit, cost and margin
Reports that show profit or margin — sales by product, sales by category, cost of goods on your dashboard and day summary — work from the cost each item was carrying at the moment it sold. That cost is captured on the sale line as it happens and never changes afterwards, which is what you want: last month's margin shouldn't move because this month's delivery arrived dearer.
The cost comes from the most specific source available — the batch the item was picked from, otherwise the average cost of your stock at that store, otherwise the cost price on the product itself. For a kit, it's the cost of the components inside it.
Sales rung up before cost tracking was added were saved without a cost, so they read as pure profit. There's a one-off tool to fix them: Settings → System Health → Rebuild historical sale costs. It walks your stock history and works out what each item actually cost when it sold. Preview first — it shows how many lines it can cost and how much cost it would record, and writes nothing until you confirm. Costs already recorded are never overwritten.
Exporting to CSV or Excel
Every report can be downloaded so you can keep a copy, share it, or work with it in a spreadsheet:
- CSV — a simple text spreadsheet that opens in Excel, Google Sheets, Numbers, or anything else. Best for feeding figures into another tool.
- Excel (XLSX) — a tidy, ready-formatted spreadsheet with headers in place. Best for sending to an accountant or filing away.
The export always matches what's on screen — same date range, same view — so there are no surprises in the file.
Large exports
CSV and Excel exports now stream records in batches, so large product, customer, supplier, inventory, purchase and report downloads use less server memory. Filters, ordering, decimal formatting, permissions and accessible-store boundaries still match the screen. Keep the request open until the download begins, and investigate any downloaded HTML/error page rather than treating it as a spreadsheet.
Tips & best practices
- Set the date range first. The whole report follows it — a wrong range is the usual reason a total looks "off".
- Check the Sales summary every morning. Comparing yesterday to the day before takes seconds and keeps you in touch with the business.
- Use Aged receivables to plan your follow-ups. The oldest balances are the ones least likely to be paid — chase those first.
- Export monthly for your accountant. A consistent monthly Excel export makes their job (and your bookkeeping) far easier.
Notes & warnings
Reports reflect the sales that have been recorded. A sale made offline only shows up once it has synced — so if a figure looks low, glance at the Sync log to confirm everything has uploaded.
What you can see may depend on your role. Some staff accounts are limited to their own sales rather than the whole shop's totals. If a report looks emptier than expected, your permissions may be narrowing it.
Related: Customer payments · Selling offline · Sales history · Taxes